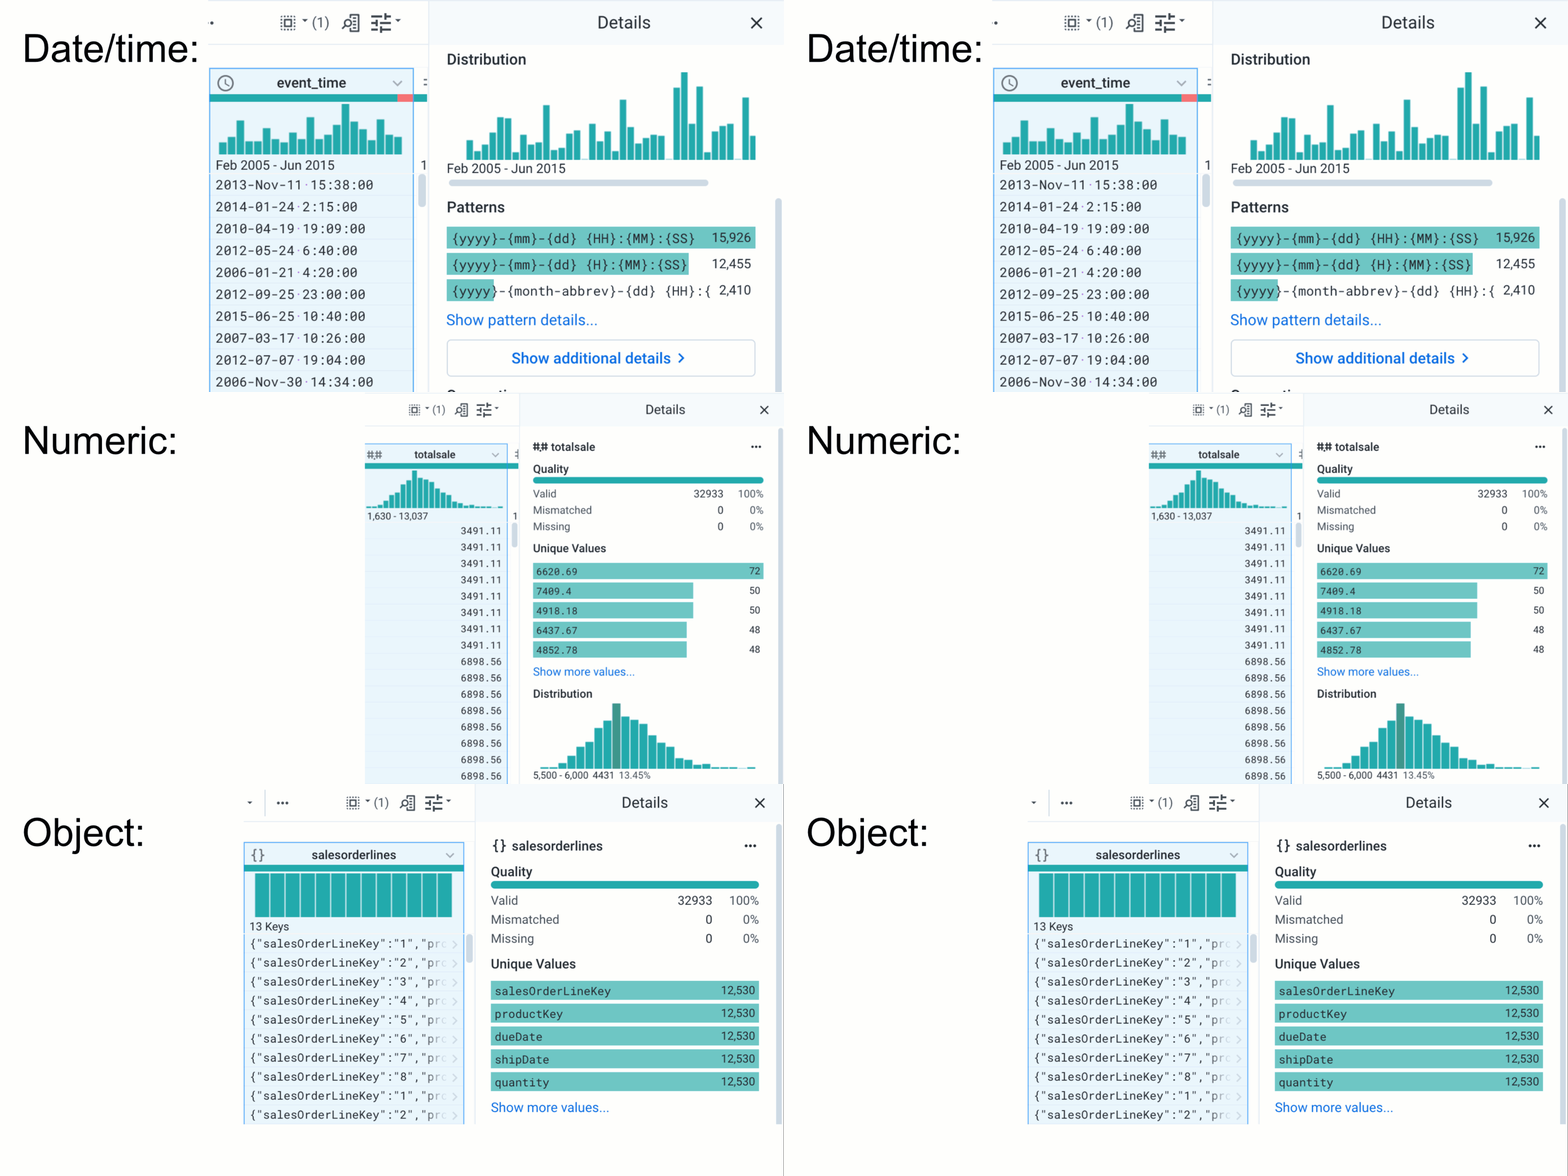
Last week, we announced our expanded focus to bring a modern approach to the process of data quality as part of our continued effort to build out a modern DataOps platform. Data quality is a hugely important piece of any organization’s data initiatives. Research shows that poor data quality costs organizations on average $9.7 million dollars in revenue per year, and we foresee that number only increasing as more and more organizations compete for better insights and more efficiency from AI and machine learning. By blending visual guidance, user interaction, and machine intelligence into an intuitive user interface, Designer Cloud Active Profiling enhances the ability to profile, discover, and validate data quality issues.
Active Profiling
A large piece of Active Profiling is surfacing relevant information and metadata to users as they interact with columns. We’ve built intelligent factories that take data (for example, the unique values in a column) and metadata (the overall data-type of the column or the name of the column) about selected columns to determine which charts and metadata to show. For continuous types like numbers or dates, we can surface precisely binned distributions; for categorical types like phone numbers, we can surface phone number formats so users can work with and standardize heterogeneous data. We also allow users to drill-down into larger data through in-depth details and unique values panels. For example, when profiling a date column, our additional details panels include breakdowns of values by month, year, day-of-week, and so on. This intelligent, multi-step approach helps users gain a richer context of their data.

Alongside these changes, we’ve also enriched our format profiler. Now surfaced directly after a user’s column interaction and powered by a scalable, unsupervised ML clustering engine, users can discover the formats of thousands of unique values.
Through this rich and responsive interface, users are a single click away from flagging, filtering, and standardizing disparate formats.
Across all these charts, we provide common interactions like chart selections and responsive context menus to tie the user experience together. We’ve built a contextual selection model to understand and generalize user interactions. When users click on columns or interact with unique values or pick specific formats, we catalog the objects they’ve interacted with and determine what actions make sense for these objects. For example, when users interact with a specific set of unique values, we understand that they may want to filter down to those values but also replace those values with other values.
We surface potential tasks users might do through context menus which are present throughout the transformation experience and act as an anchor for users.
We also leverage our ML service to score these potential task based on profiles and other rich metadata about the selected objects and provide ranked suggestions.
Finally, we’ve started exploring how data-oriented views like our transformation grid can surface metadata. As users interact with the surfaced profiles, we asynchronously compute the cross-section of user selection in profiles and data in the grid. Powered by our in-memory Photon engine, we stitch together row- and cell-level information on which cells are selected. As user selections change and evolve, we re-render the transformation grid to reflect the metadata they’re interacting with. Using a combination of custom d3 and React, we’re able to refresh relevant pieces of the page while keeping the user’s experience stable; we can update what has changed on the order of 100s of milliseconds so that user interaction flows smoothly without interruptions.
What’s Next
Live feedback and constant validation is a guiding philosophy of our user experience, and we look forward to finding new and exciting ways that we can continue to improve visual guidance and incorporate machine learning to make the task of understanding and resolving data quality issues intuitive to users of all backgrounds. To get started with Designer Cloud, sign up today.