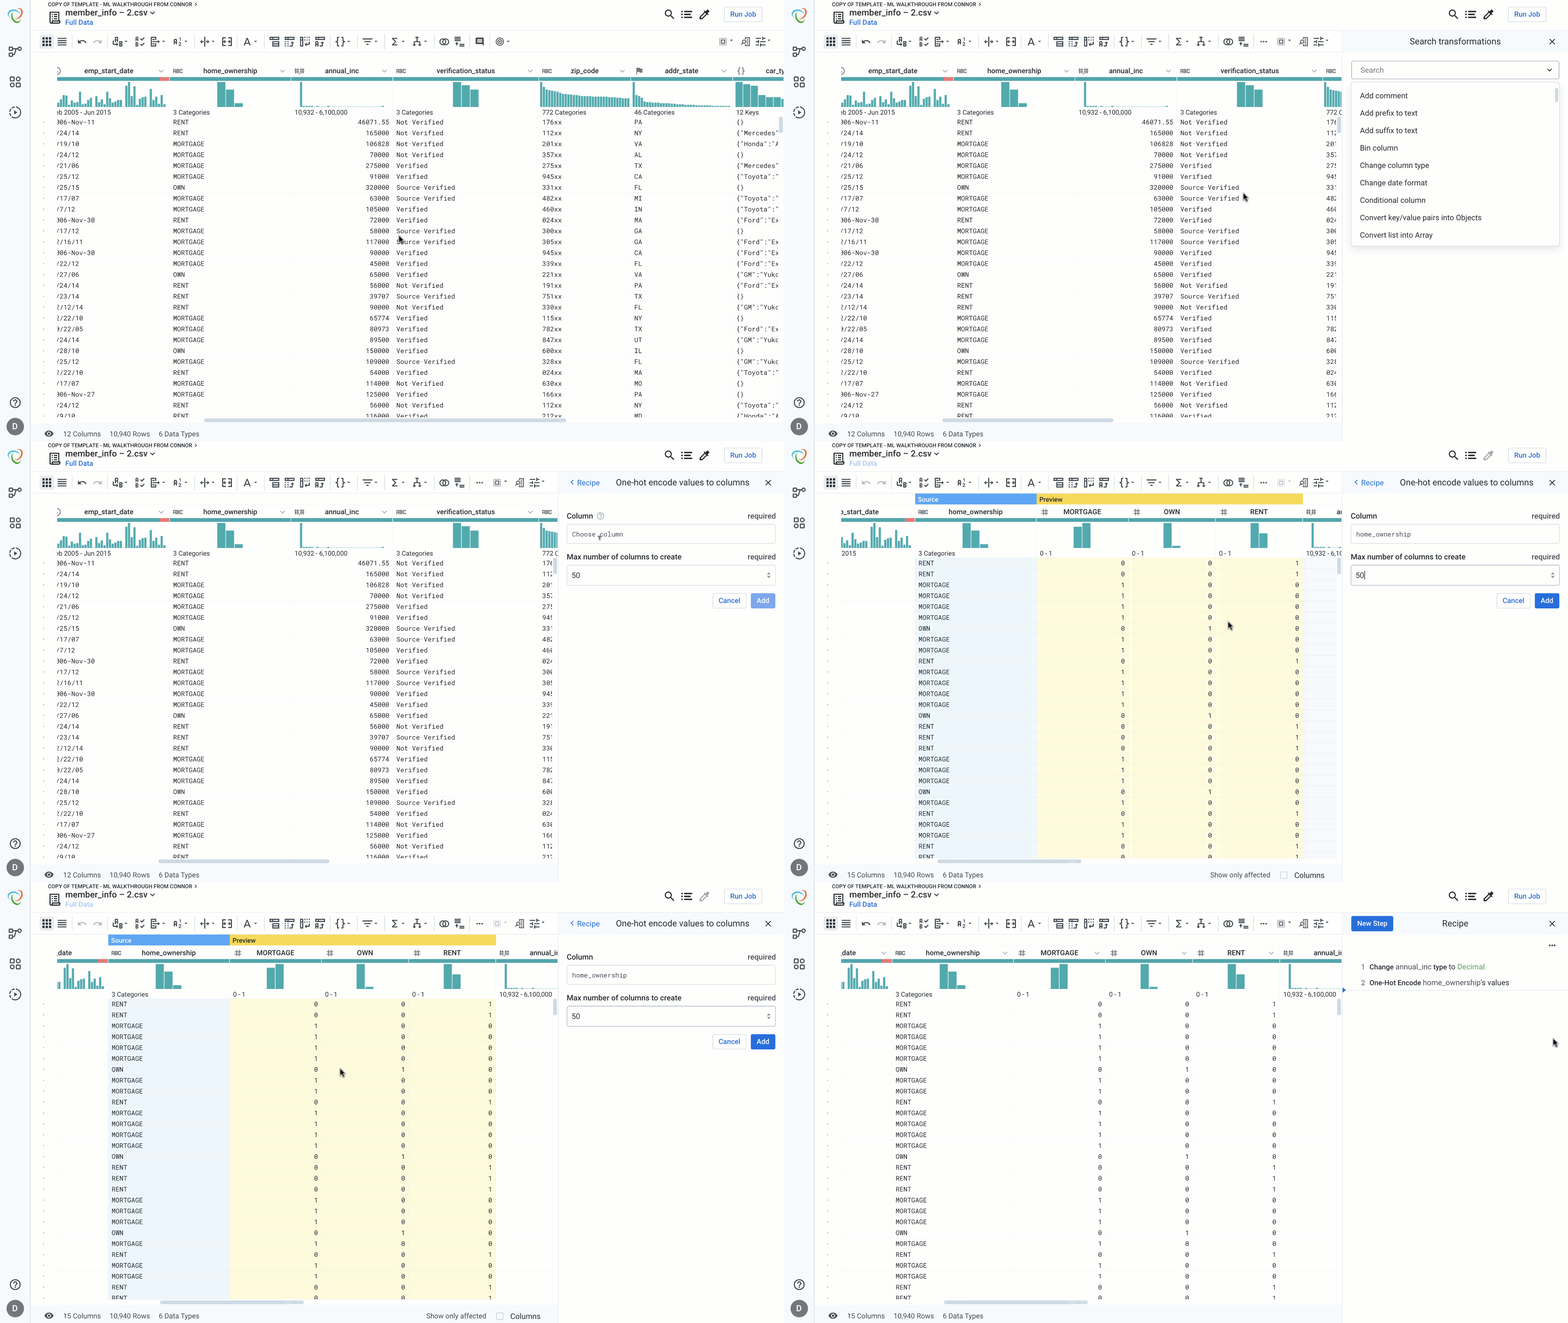
Machine Learning models require data to be formatted in a certain way in order to maximize the value of the algorithms. In addition to structuring, blending with other sources, and cleaning data, there are various additional steps often needed to get the data into the correct format. This feature highlight will focus on a few of these functions that are part of Designer Cloud’s extensive catalog of transformation steps. The four that we will feature are:
- One-Hot Encoding
- Binning
- Dealing with Skewness
- Scaling
In the example we show, we will be dealing with a categorical column that we want represented as a binary (0 and 1) indicator column, and a numeric column that is skewed to the right that we want resembling a normal distribution between 0 and 1. We also want to bin the numeric column into discrete categories. We will show how this can be done easily with built in functions in Designer Cloud.
One-Hot-Encoding:
One hot encoding helps to transform categorical features into binary values – present or not present. For each unique value in the feature under consideration we generate a new column with value 1 to indicate the presence of the value in that record and 0 to indicate the absence of the value in the record. We can do this in a single step in Designer Cloud.

Binning:
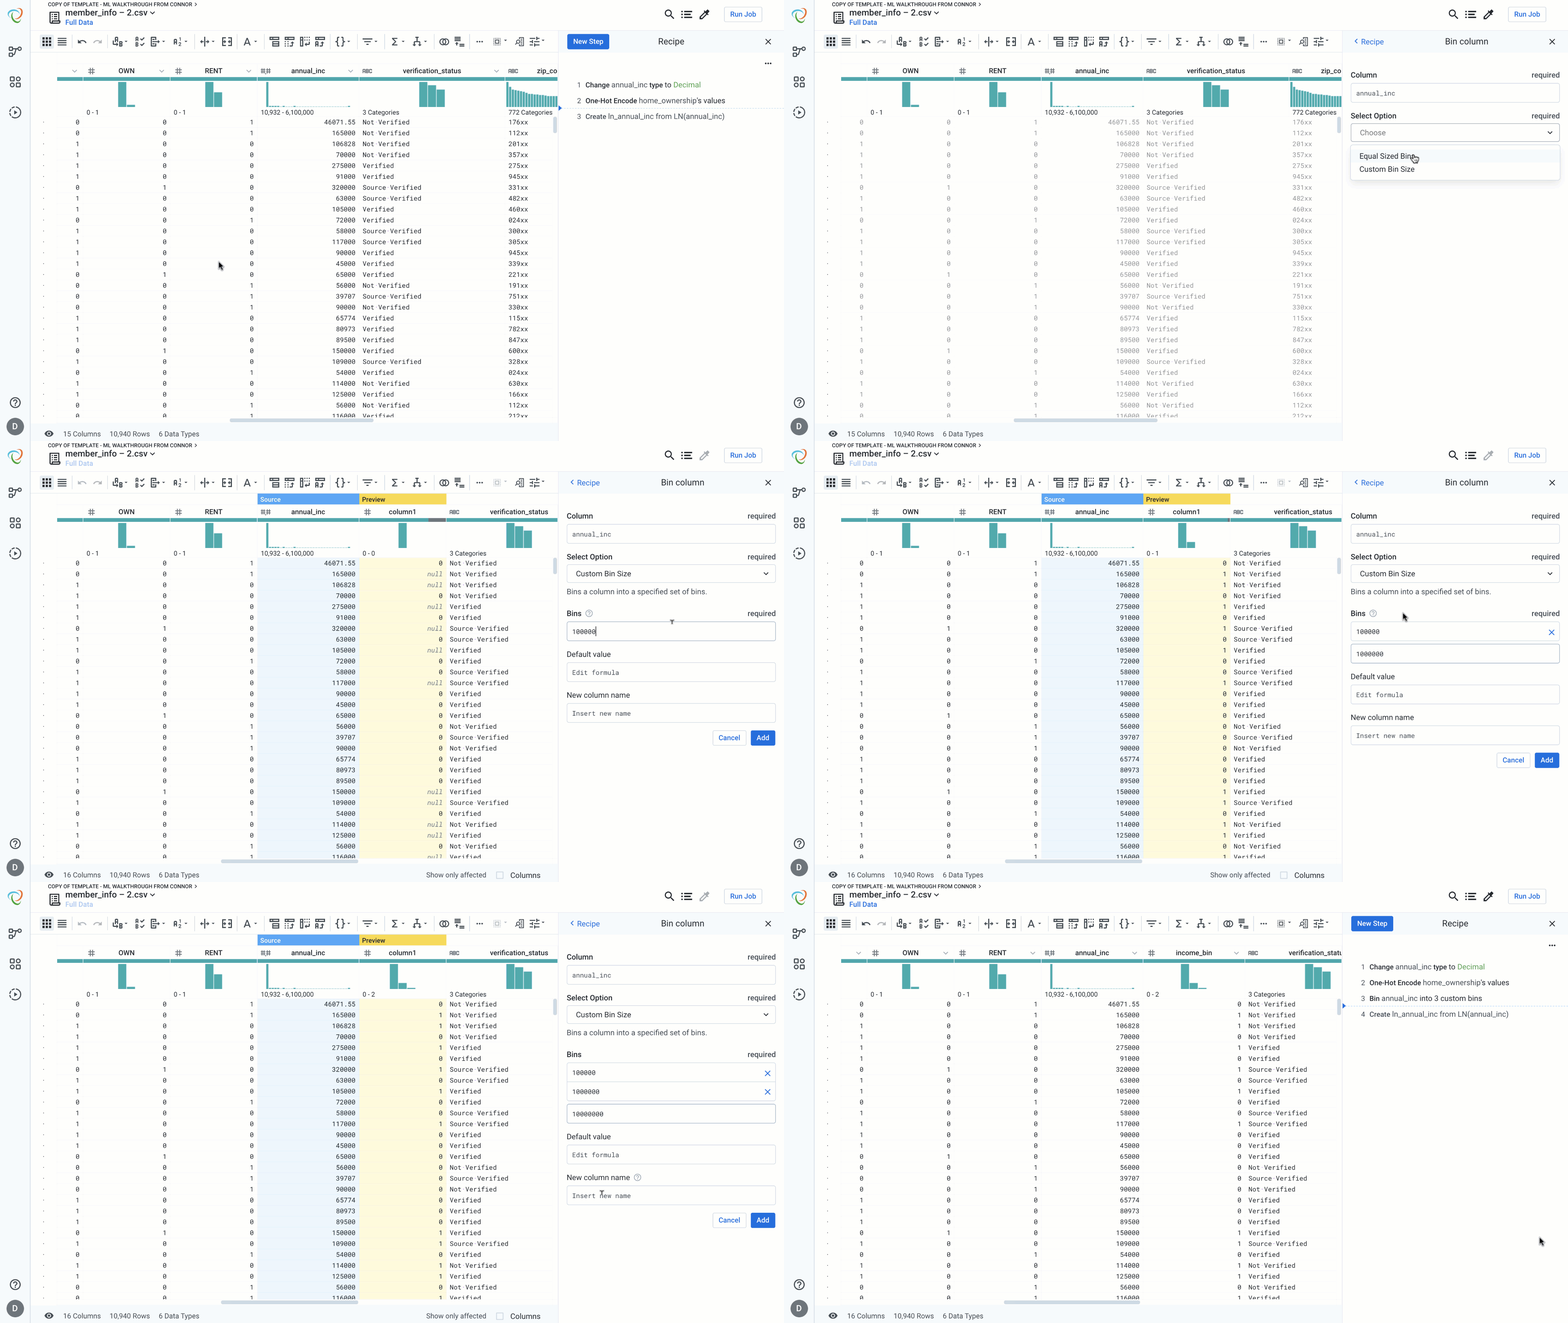
Binning is used to transform real valued features into categorical features. Equal sized bins are used to break the feature into equal sized categories. Custom bins should be used when we know that a given range belongs to a specific category (think age categories for movie tickets).
In this example, we are going to break our annual_inc column into three separate categories. If we wanted to go a step further we could then convert each of these values into custom categorical values like low, mid, high, etc.

Skewness:
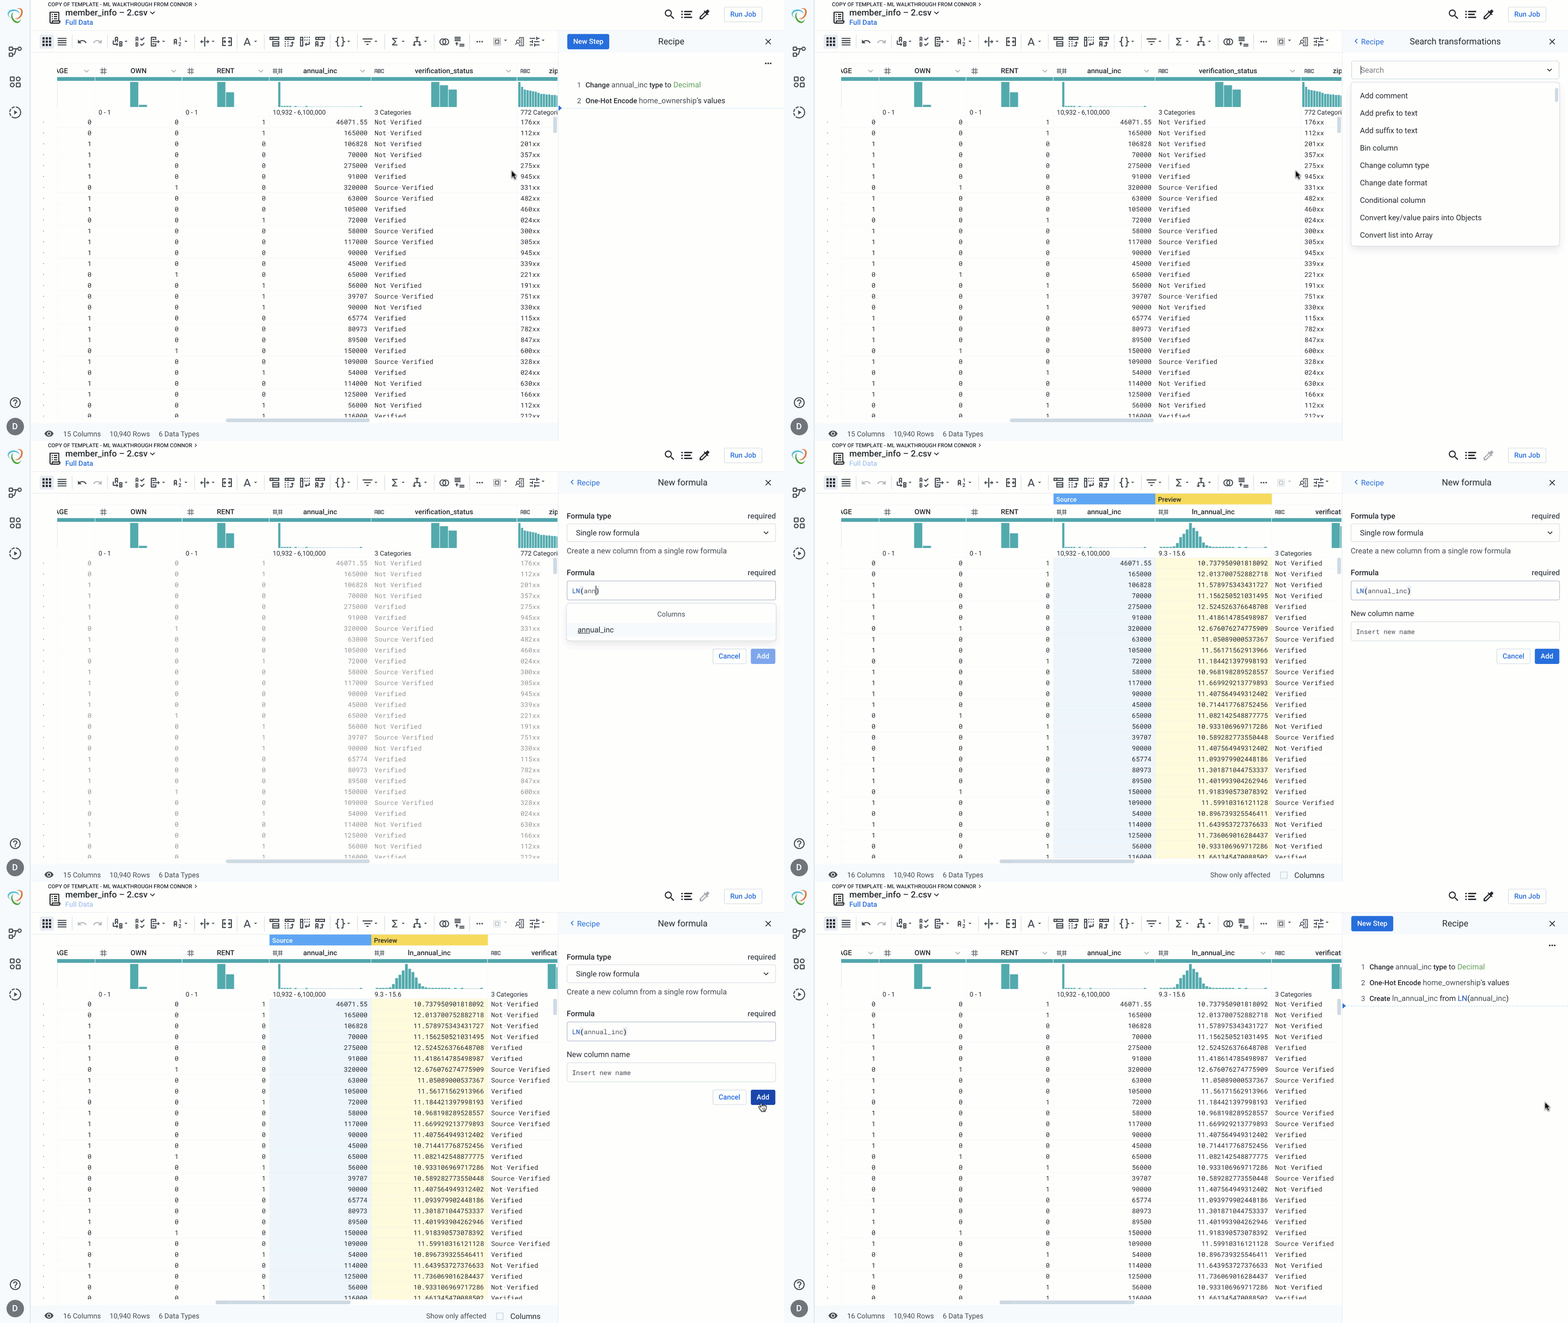
Skewed data can negatively impact regression models. Common methods for correcting for skewed data involve taking the log or natural log of a column. Notice in the example below that the preview of the column automatically updates to give us validation that this step will create a column that closely resembles a normal distribution, rather than values skewed heavily to the right. This visual validation gives us confidence that this step achieves the desired result.

Scaling:
Feature scaling is known to help certain machine learning algorithms like gradient descent converge faster. Scaling can prevent certain features from being given more importance due to varying ranges. There are two types of scaling you can do in Designer Cloud.
- Feature Standardization: Feature standardization makes the values of a feature in the dataset have zero-mean and unit-variance. The general method of calculation is to determine the mean and standard deviation for the feature. Next we subtract the mean from the feature. Then we divide the values (mean is already subtracted) of the feature by its standard deviation.
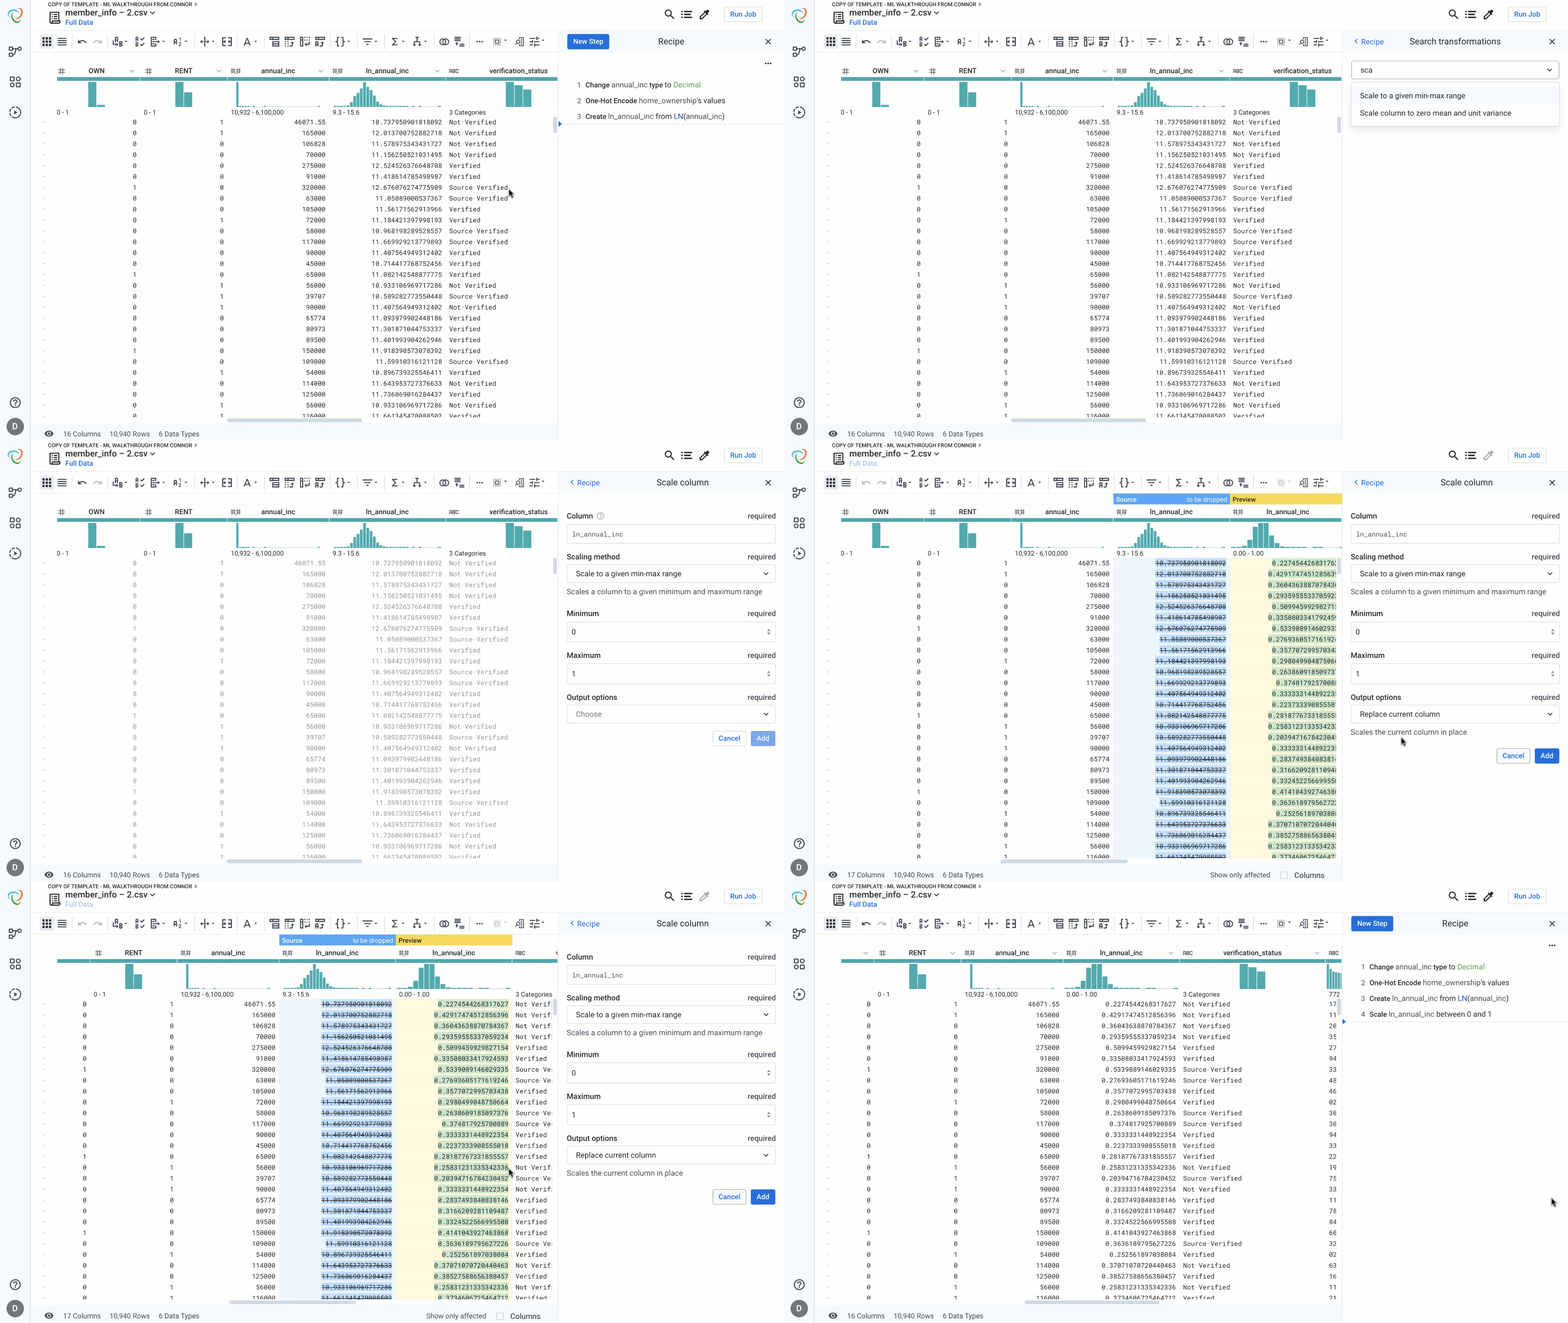
- MinMax Scaling: Min Max Scaler transforms the feature by scaling it between given min and max range. This type of scaling helps preserve zero entries in sparse data as well as robustness to small standard deviations of features.
We’ll use MinMax Scaling in this example to scale between 0 and 1. Again, notice that the preview gives us validation that the resulting column falls between 0 and 1.

The above are a few examples of functions to help machine learning and AI use cases. Try these out, and many more, sign up for Designer Cloud today!