Editor’s Note: This blog is co-authored by Maria Ho, Product Marketing Manager at Alteryx, who focuses on product releases and messaging for Reporting for Designer Cloud. She drives go-to-market strategies and creates engaging content to showcase product with each new release, and Gayatri Kakarlapudi, product manager focused on working with Alteryx customers to build valuable data analytics products.
Data workers need the ability to create personalized reports and share them with colleagues to quickly and easily turn data into actionable insights.
But do your analytics reports allow you to author, export and share, and access from anywhere, at any time, and on any device? If you can’t do all this with your analytics reports now, they are significantly hindering your organization’s ability to effectively make decisions at scale.
Today, Alteryx is excited to share a new Reporting for Designer Cloud experience that incorporates all the authoring strengths of our existing reporting capabilities with easy access through the cloud.
Reporting helps data workers share data insights across all levels of an enterprise without friction, making it easy to create personalized data visualizations, export and share reports with anyone, and consume data easily that helps make intelligent decisions. Whether you are a beginner or an advanced data analyst with years of Alteryx experience, you will be able to build intuitive visualizations and generate consumable reports easily that help you make informed decisions for your organization.
Watch a Video Overview
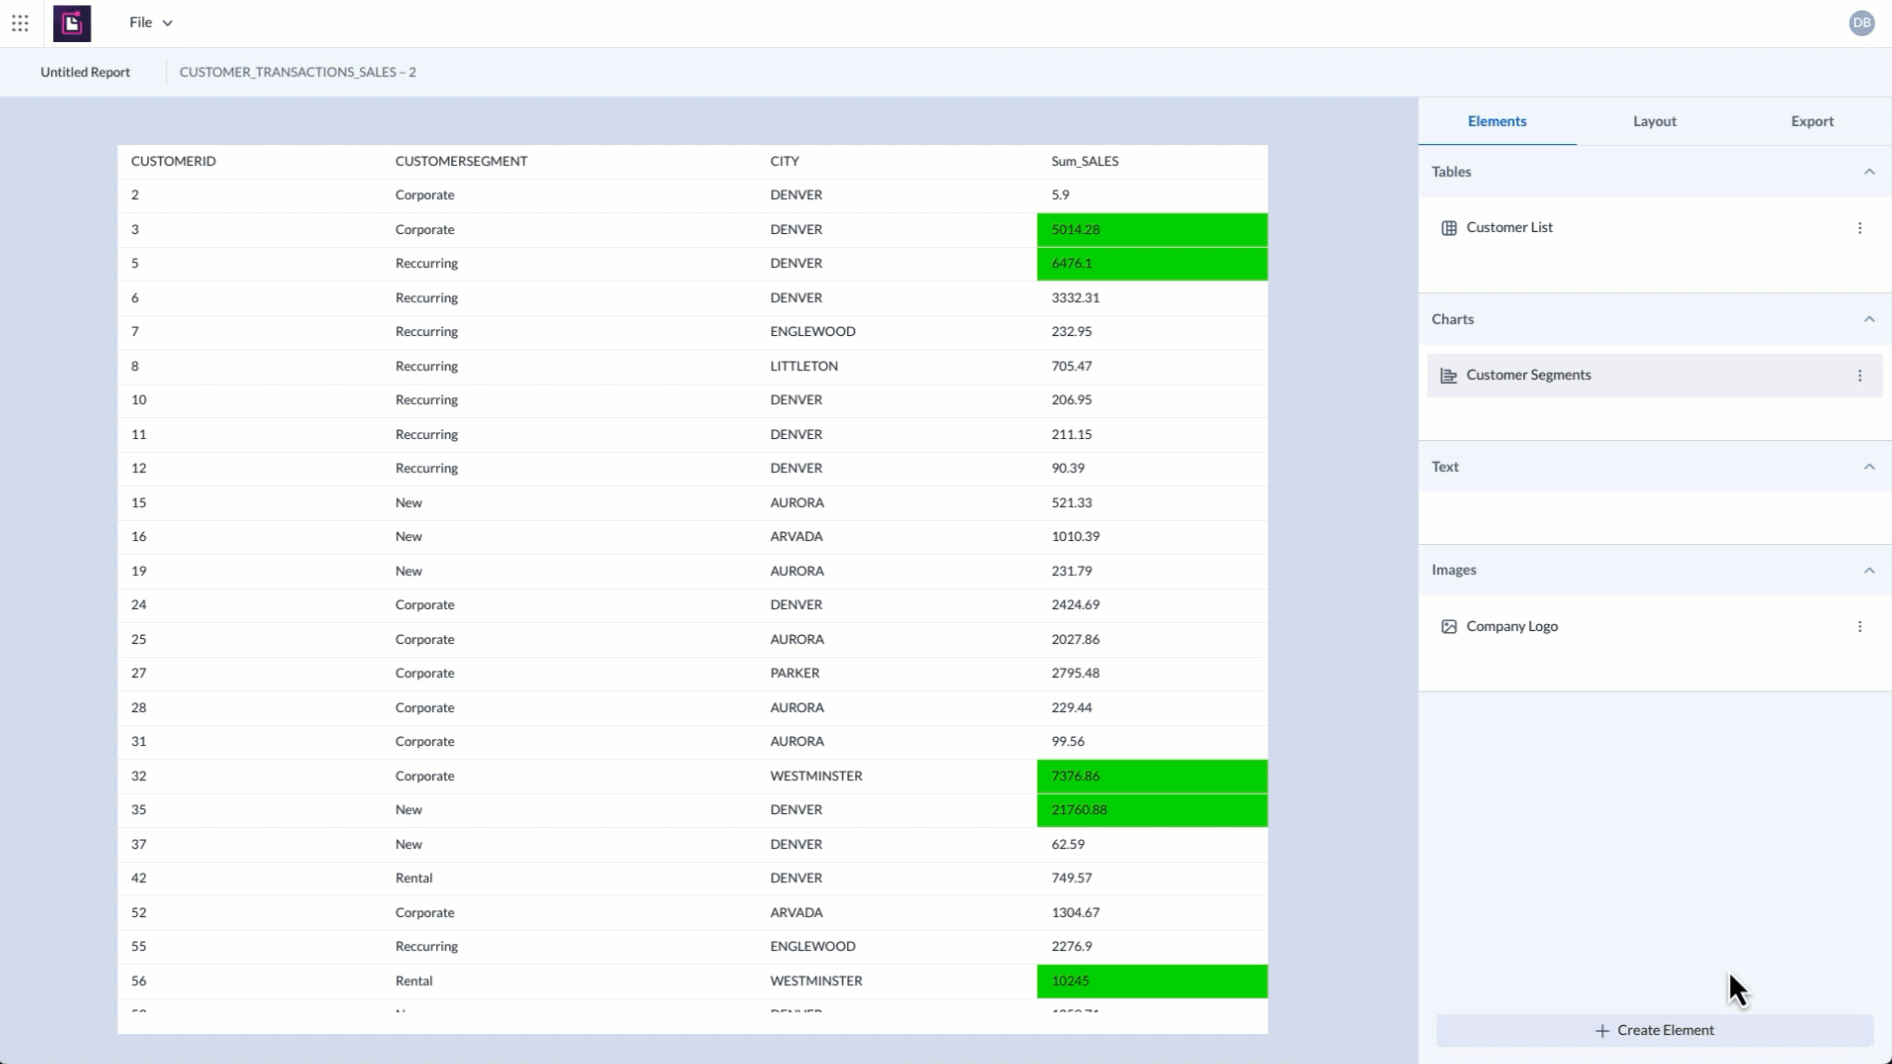
Reporting for Designer Cloud is designed to make reporting and data visualization simpler and more intuitive. While Reporting tools in Alteryx Designer allow users to create high-quality data-driven reports in a user-friendly interface, the new Reporting for Designer Cloud experience gives you a drag-and-drop report preview canvas that helps you configure report elements and layout reports more easily in the cloud. Access Reporting from the app switcher within the platform. Once you are in the application, start by choosing from your library of imported datasets to begin building reports.
After the data is loaded in, you can begin creating your report elements. You can create tables with conditional formatting and output to XLSX. You can configure bar charts with simple aggregations and styling, static text elements, and you can add an image such as your company logo to customize the report. And of course, you can always use the easily formatted report to automate visualizations in your dashboarding tool of choice.
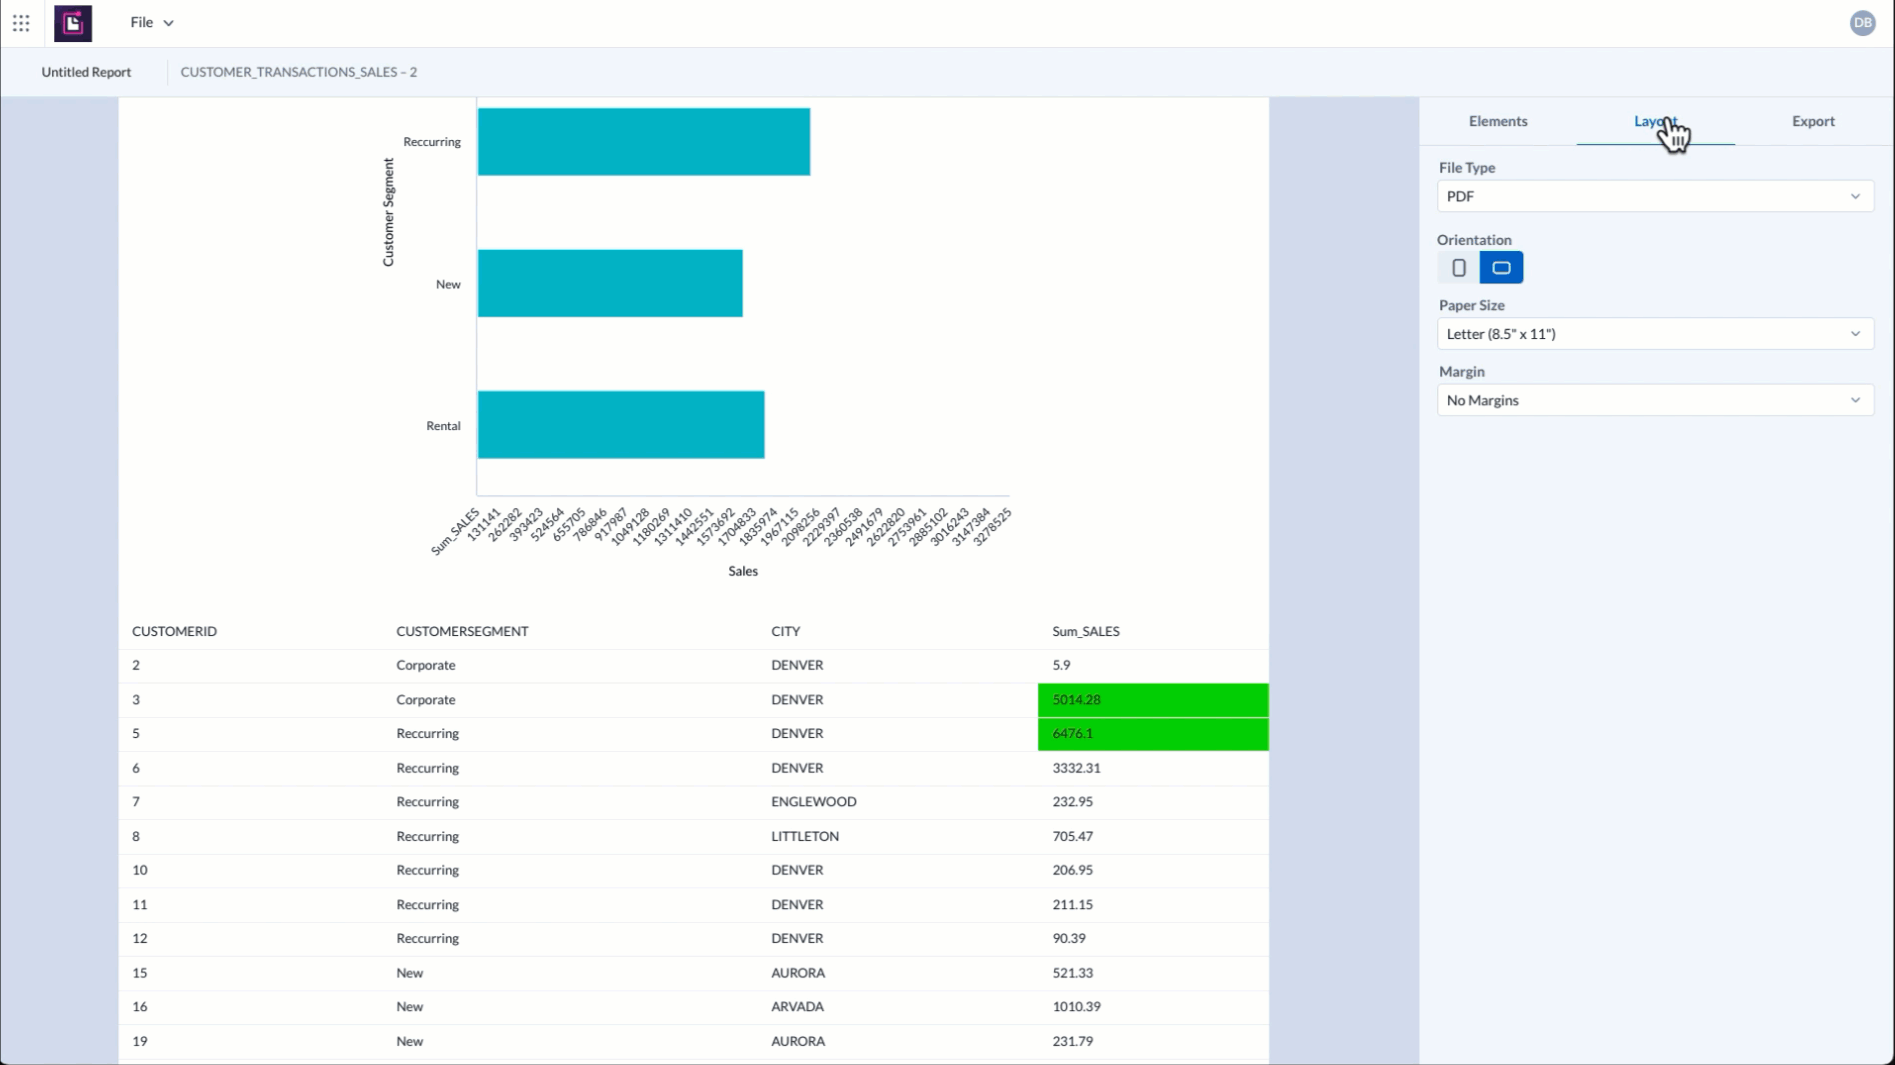
Once you’ve built and laid out your report as you like, you can select a PDF output and customize the orientation, page settings, and page margins before you decide to download the report and share for consumption. You can also choose to save your report output to our file system. And you can choose to save your report configuration progress if you need to come back to it or you can open previously started reports to continue building on.
The Alteryx Analytics Cloud Platform is designed to be easy to use, flexible, and scalable, making it a powerful solution for organizations of all sizes that are looking to turn their data into actionable insights. Transform your organization’s data with the new Reporting tools and see the difference today.